|
|
|
 |
|
|
Biological Soil Crusts (BSC): Duruchaus
Introduction |
Biological Soil Crusts (BSC) occur in all biomes along the BIOTA-South transect except for the Fynbos. They can be classified into different types depending on the developmental time and the organism composition: three developmental stages of cyanobacterial crusts, mostly associated with green algae (ranging from initial to well developed crusts), lichen crusts (differentiated in cyanolichen and green algal lichen crusts), bryophyte and liverworth crusts, and the hypolithic crust type (community of photosynthetic organisms existing on sides and underneath translucent stones, e.g. quartz) occurring specifically in quartz gravel pavements (e.g. Knersvlakte - observatories Flaminkvlakte and Luiperskop, Namib Desert - observatory Wlotzkasbaken) but also underneath single quartz rocks of different sizes in other regions and biomes (e.g. observatory Ovitoto). Driving forces of such spatial variability of BSC types are climatic, topographic, pedogenetic and land use differences (as in observatory pairs such as Narais and Duruchaus) in different biomes along the transect. |
Dominant Crust Type |
initial to well developed crust with lichens and bryophytes (depending on grazing pressure) |
Biological Soil Crust Biomass (chlorophyll) |
high |
BSC Biomass ranking (from BSC chlorophyll a+b values [mg/m2] )very low <= 10low = 11 to 50medium = 51 to 100high = 101 to 200very high > 200 |
 |
Main cyanobacteria genera |
|
analysis in progress |
Main green algae genera |
|
analysis in progress |
Implementation of molecular identification techniques - Cyanobacteria |
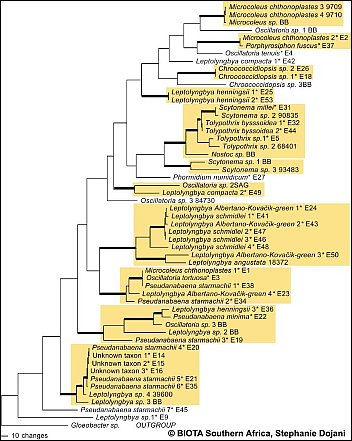 Fig.A: Preliminary results of sequence data is shown in 1 of 6 most parsimonious trees based on 16S rDNA sequences. Asterisks indicate taxa found along the BIOTA South transect.(Please click on map) Fig.A: Preliminary results of sequence data is shown in 1 of 6 most parsimonious trees based on 16S rDNA sequences. Asterisks indicate taxa found along the BIOTA South transect.(Please click on map)
|
The polyphasic approach (morphology and sequence data) is expected to give reliable results in detection of taxa diversity of cyanobacteria. However preliminary results of the molecular analysis of selected cyanobacteria strains (1 of 6 most parsimonious trees based on 16S rDNA sequences) indicate that most of the investigated genera (/Leptolyngbya, Pseudanabaena, Scytonema, Microcoleus/) are polyphyletic. These results are in concordance with findings e.g. by Casamatta et al. 2005. In a second approach, the more variable intertranscribed spacer (ITS) was amplified, which is expected to provide further information on species level.  Casamatta, D.A, Johansen, J.R., Vis, M.L., Broadwater, S.T., 2005,Molecular and morphological characterization of ten polar andnear-polar strains within the oscillatoriales (cyanobacteria)J. Phycol. 41, 421-438. Casamatta, D.A, Johansen, J.R., Vis, M.L., Broadwater, S.T., 2005,Molecular and morphological characterization of ten polar andnear-polar strains within the oscillatoriales (cyanobacteria)J. Phycol. 41, 421-438.
|
Implementation of molecular identification techniques - Green algae |
Regarding the algae in BSCs, a large fraction of the algal community appears to be non-culturable, but contributes considerably to the crust biodiversity. Recent studies demonstrate that the true taxonomic affiliations of microscopic desert green algae can only be established reliably with the aid of DNA sequence data, particularly 18S rDNA data. Thus molecuar techniques are required to complement the cultural approach in order to achieve a more reliable assessment of the biodiversity actually present in BSCs. SSU rRNA gene cloning and sequencing is the best established technique for assessing biodiversity from environmental samples with molecular techniques. A more rapid and easy to use technique is DGGE which in combination with cloning/sequences has been found a very useful method to investigate biodiversity of microalgae in and on rocks.Maximum likelihood phylogenies demonstrating the high phylogenetic diversity of green algae obtained from Biological Crusts of 16 different sampling sites in Southern Africa.A total of 279 green algal sequences were obtained from cultures (204) and clone banks (75). They are distributed on many independent lineages and clades comprising the green algal classes Chlorophyceae (Fig. B; 206 sequences) and Trebouxiophyceae (Fig. C; 73 sequences). Colour-coding is used to show the various origins of the groups of green algae. The origin of strains/clones is given in boxes with the number of studied strains/clones per locality. So far, in most cases only a rough genus assigment is possible and several yet unidentified lineages/clades may represent new genera and/or species. Green algae from the "cf. Deasonia", "Scenedesmus deserticola" clades and from a still unidentified chlorophyceaen clade are among the most frequently occuring algal species. There is a general trend with carotenoid-accumulating members of the Chlorophyceae being more abundant than non-carotenoid accumulating Trebouxiophyceae.The phylogenies were obtained from the ARB SSU rDNA sequence database in which partial sequences (350-800 nts in length) from Biological Crust Green Algae were compared with corresponding full-length green algal sequences public databases and unpublished sources using a 50% position conservation filter. Groups of sequences with similarities among each other of 99% and above were collapsed into one triangle. Scale, 10% estimated genetic difference. |
") Fig. B: green algal sequences for class Chlorophyceae (206 sequences) (Please click on map) Fig. B: green algal sequences for class Chlorophyceae (206 sequences) (Please click on map)
|
") Fig.C: green algal sequences for class Trebouxiophyceae (73 sequences) (Please click on map) Fig.C: green algal sequences for class Trebouxiophyceae (73 sequences) (Please click on map)
|
Related Map(s) |
 |
Please click on map(s) |
Effects of human impact on the dynamics and diversity of BSCs |
An intense disturbance gradient caused by land use regarding Biological Soil Crusts was observed at the observatory pair Narais and Duruchaus in the Highland Savanna (Rehoboth). Although BSCs are common and well established at both observatories and contribute considerably to the ecosystem biomass (chlorophyll a values reaching over 130 mg/m²), there are distinct differences in BSC distribution and disturbance effects on BSCs between the two farms. For instance the intensively grazed Duruchaus observatory showed a higher variability of chlorophyll values, possibly due to varying disturbance intensities over the farm. Lower chlorophyll a values were also associated with lower successional crusts (lighter in colour, fig. 1) and higher values with higher successional crusts (dark coloured, fig. 2), often including soil lichens.  From left to right - Please click on figure Fig. 1: Biological soil crust at lower successional stage (lighter in colour, some darker spots) in the Rehoboth areaFig. 2: Biological soil crust at higher successional stage (dark in colour), including soil lichens, in the Rehoboth area
Investigations of the Biological Crusts at the four experimental grazing and non-grazing plots, two on each farm (fig. 3, fig. 4), and at two plots on the adjoining observatories revealed strong differences in BSC coverage and composition between the plots of different grazing intensities. The historically less intensely grazed Narais plots had a higher total crust coverage (reaching values of 55% coverage in vegetation interspaces, fig.5) than the historically intensely grazed Duruchaus plots. Bare soil coverage, as indicator for trampling intensity, was low at the Narais plots and much higher at the Duruchaus plots with the highest bare soil coverage at the Duruchaus observatory plot (fig.5). Regarding crust composition, well developed cyanobacteria crusts including lichens and bryophytes showed a significantly higher coverage at the Narais plots compared to the more intensely grazed Duruchaus plots. The proportion of well developed crusts is expected to increase over time at the exclosed plots. Regarding green algae diversity, preliminary molecular analyses revealed in few cases the presence of green algal rDNA genotypes that have already been found in North American desert soils, whereas the majority of green algae found were not known from desert habitats or may even represent new species. Specific PCR primers have successfully been developed to obtain green algal DNA-enriched rDNA clone libraries and facilitate analyses of raw cul-tures.   From left to right - Please click on figure Fig. 3: BSC coverage investigations and BSC sampling at four experimental sites of different grazing intensities and exclusion from grazing at the Narais and Duruchaus farmsFig. 4: Fence line effect between the strongly grazed Duruchaus farm and the experimental exclosure (non-grazed).Fig. 5: Results from BSC coverage investigations at the Narais and Duruchaus farms comparing BSC coverage with open soil coverage(historically less intensely grazed plots: Narais = Na; historically more intensely grazed plots: Duruchaus = Dumomentaneously grazed plots: grazed = gra, non-grazed plot = exclosure =exc; grazed observatory plot at farm = obs)
In conclusion, Biological soil crusts are sensitive to disturbance, leading to a reduction in species diversity, biomass and surface cover, thus influencing BSC functions. Intense and repeated disturbances result in crust disturbance and exposure of bare soil, thus enhancing soil loss due to erosion by wind and water. |
|
|
|


 "Green algal sequences for class Chlorophyceae (206 sequences)")
 "Green algal sequences for class Trebouxiophyceae (73 sequences)")


