Trees and seedlings data of Kakamega and Budongo Forest
Kakamega Forest, Kenya
The mean extrapolated tree number per hectare taking all observatories into consideration was 562 trees with DBH ≥ 10 cm.
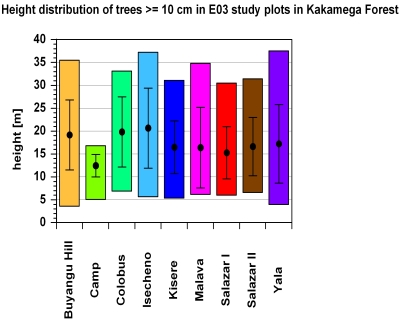
The average height reached by the trees in the study sites for trees with ≥ 10 cm DBH was 12.4 m in the Camp-site plots and
around 20 m in the Colobus and Isecheno sites. The tallest tree in all sites was an Olea capensis with a height of 38.4 m.
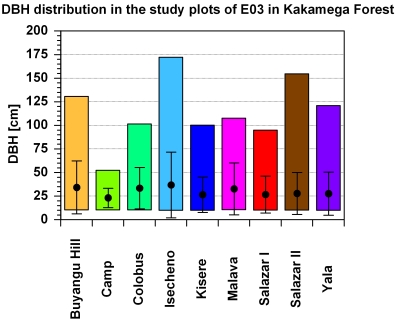
The tree with the largest DBH of 156 cm was a Zanthoxyllum gilletii. The tree structure with regard to DBH and height
distribution appeared to be more or less uniformly distributed (Figs. 1&2) with the exception of one site (Camp). The volume of
wood (a cone with the ground diameter and height of a tree) ranged from 12.2 m3 to 106.6
m3 per hectare for the different observatories.
 |  |
|
Fig.1 The height distribution of trees ≥ 10 cm DBH in the BIOTA East BDO's in Kakamega Forest is shown.
The bars represent the range, the dots the mean with standard deviation.
|
Fig.2 The diameter distribution of trees ≥ 10 cm DBH in the BIOTA East BDO's in Kakamega Forest is presented.
The bars represent the range, the dots the mean with standard deviation.
|
Mean extrapolated tree number per hectare over all sites was 611 ≥10 cm DBH. The mean tree heigths in the sites ranged
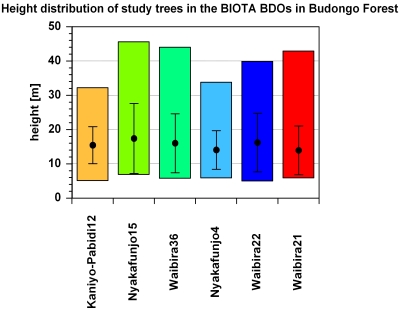
from 10.3 m in Waibira 21 (W21) to 13.8 m in N15. The tallest tree over all the sites was a Cynometra alexandri with a
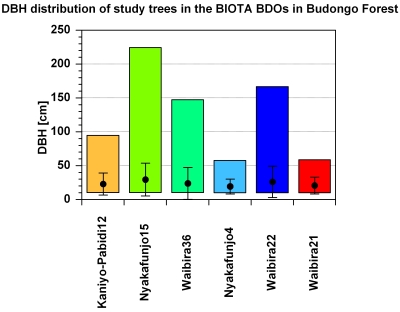
measured height of 45.6 m. The tree with the largest DBH was an individual of Alstonia boonei with 224.4 cm. The
distribution of the height and DBH per site (Figs. 3 & 4) showed that trees in the nature reserve Nyakafunjo 15 (N15)
contain highest values with least found in Nyakafunjo 4 (N4) and W21. Basal areas per hectare for trees ≥5 cm ranged
from 19.92 m2 in KP12 to 104.81 m2 in N15. The sites contained 46.57 m2 basal area on
average per hectare.
 |
 |
|
Fig.3 The height distribution of trees ≥10 cm dbh in the BIOTA East BDO's in Budongo Forest is shown.
The bars represent the range, the dots the mean with standard deviation.
|
Fig.4 The diameter distribution of trees ≥10 cm dbh in the BIOTA East BDO's in Budongo Forest is presented.
The bars represent the range, the dots the mean with standard deviation.
|
A tree inventory of each of the mentioned BDO's was done in Kakamega and Budongo Forest for trees ≥5 cm DBH in
plottripletts (3*400 m2) representing one observatory. The basic structural data are shown. Further mean
annual growth rates of the trees ≥10 cm DBH in the respective BDO are presented.
The inventory of the seedling community was done in each observatory in sixteen 4 m2 plots in both forests.
Mean annual density, mortality and survival per m2 are listed. Further the diversity indexes for the seedling
plots is given for the respective observatory. Additionally litterfall values are presented for the year 2003/04 recorded
in three observatories and extrapolated for one hectare.
Abbreviations:
DBH - Diameter at breast height
In each of the mentioned sites three 20 by 20 meter plots for long term measurements were installed in 2001.
Kakamega Forest: Trees ≥5cm DBH
| Observatory |
tree no. per plot triplett |
mean circumferance
[cm] |
basal area
[m2*ha-1] |
mean DBH
[cm] |
tree per ha |
mean height
[m] |
No. of species
≥ 5cm
per triplett |
Shannon Wiener H' |
Growth rate** 2004
[cm*yr-1] |
Growth rate** 2005
[cm*yr-1] |
Growth rate** 2006
[cm*yr-1] |
| Buyangu Hill* |
133 |
63.71 |
77.30 |
19.25 |
1108 |
14.37 |
37 |
4.61 |
0.79 |
0.87 |
0.78 |
| Colobus* |
107 |
66.99 |
54.46 |
20.86 |
892 |
15.60 |
31 |
4.29 |
0.57 |
0.57 |
0.51 |
| SalazarI* |
137 |
48.42 |
46.01 |
13.50 |
1142 |
12.93 |
33 |
4.2 |
0.70 |
0.73 |
0.63 |
| SalazarII* |
121 |
60.74 |
56.85 |
17.07 |
1008 |
13.43 |
33 |
4.52 |
0.75 |
0.72 |
0.71 |
| Camp |
184 |
41.87 |
22.24 |
12.74 |
1533 |
8.93 |
29 |
3.69 |
|
|
|
| Isecheno |
89 |
71.54 |
83.49 |
22.77 |
742 |
14.16 |
31 |
4.45 |
|
|
|
| Kisere |
102 |
57.95 |
59.72 |
18.45 |
850 |
13.20 |
22 |
3.79 |
|
|
|
| Malava |
79 |
55.52 |
47.09 |
17.24 |
658 |
11.12 |
29 |
4 |
|
|
|
| Yala |
134 |
55.97 |
55.32 |
17.65 |
1117 |
12.75 |
24 |
3.58 |
|
|
|
|
*Plots with dendrometers measured monthly and seedlingplots
measured every three months. **of trees ≥ 10cm
|
Kakamega Forest: Seedlings ≤ 100 cm height. Mean annual values for the period from 2002 to 2007
| Observatory |
Mean seedling density per m2 |
Mean seedling mortality per m2 |
Mean seedling recruitments per m2 |
Simpson Index |
Shannon-Wiener H' |
| Buyangu Hill* |
15.82 |
1.57 |
2.15 |
0.436 |
1.167 |
| Colobus* |
16.85 |
1.90 |
2.11 |
0.872 |
2.405 |
| SalazarI* |
9.12 |
2.00 |
2.10 |
0.746 |
1.915 |
| SalazarII* |
8.39 |
0.42 |
0.74 |
0.752 |
1.974 |
| Isecheno |
3.56 |
0.16 |
0.33 |
0.901 |
2.481 |
| Kisere |
4.61 |
0.32 |
0.48 |
0.869 |
2.262 |
| Malava |
3.50 |
0.58 |
0.68 |
0.767 |
1.723 |
| Yala |
5.72 |
0.22 |
0.42 |
0.868 |
2.476 |
|
*Plots with dendrometers measured monthly and seedlingplots
measured every three months.
|
Budongo Forest: Trees ≥5cm DBH
| Observatory |
tree no. per plot triplett |
mean circumferance
[cm] |
basal area
[m2*ha-1] |
mean DBH
[cm] |
tree per ha |
mean height
[m] |
No. of species
≥ 5cm
per triplett |
Shannon Wiener H' |
Growth rate** 2006
[cm*yr-1] |
| W22* |
182 |
43.93 |
50.62 |
13.99 |
1517 |
11.54 |
35 |
4.11 |
0.47 |
| N15* |
158 |
64.33 |
104.81 |
20.48 |
1092 |
14.70 |
18 |
4.32 |
0.29 |
| N4* |
161 |
46.46 |
52.27 |
14.79 |
1517 |
11.22 |
36 |
4.16 |
0.49 |
| W21* |
131 |
37.00 |
27.95 |
11.66 |
1492 |
10.63 |
36 |
4.33 |
0.40 |
| W36 |
145 |
49.79 |
82.59 |
15.77 |
1458 |
12.69 |
24 |
4.52 |
|
| KP12 |
164 |
36.78 |
19.92 |
11.67 |
1225 |
11.88 |
21 |
4.39 |
|
|
*Plots with dendrometers measured monthly and seedlingplots
measured every three months. **of trees ≥ 10cm
|
Budongo Forest: Seedlings ≤ 100 cm height. Mean annual values for the period from 2005 to 2007
| Observatory |
Mean seedling density per m2 |
Mean seedling mortality per m2 |
Mean seedling recruitments per m2 |
Simpson Index |
Shannon-Wiener H' |
| KP12 |
5.41 |
0.24 |
0.61 |
0.796 |
1.863 |
| N15* |
7.32 |
1.21 |
1.59 |
0.828 |
2.072 |
| N4* |
2.06 |
0.20 |
0.36 |
0.688 |
1.438 |
| W21* |
4.39 |
0.27 |
0.58 |
0.768 |
1.839 |
| W22* |
5.28 |
0.32 |
0.73 |
0.901 |
2.540 |
| W36 |
8.78 |
0.96 |
0.96 |
0.744 |
1.646 |
|
*Plots with dendrometers measured monthly and seedlingplots
measured every three months.
|
Litterfall in Kakamega Forest 2003/04
| Observatory |
t/(ha*yr) |
| Buyangu Hill |
13.35 |
| Colobus |
12.88 |
| SalazarI |
10.06 |
| Mean |
12.10 |
|



 Go to the WeatherNet


